Understanding Auto Decision
I have been experimenting with Auto Decision, a project created by Harshil Mathur, and I found the concept fascinating.
It helped me think about decisions in a more structured way. The process pushes you to think deeper. And as AI agents get better, this becomes even more useful. You can let them research, simulate, and keep thinking through a problem so you can make a more informed call.
It feels like having a board of people discussing one decision. They explore first-order and second-order effects, challenge each other, and build one document that lays out what could happen.
This post is simply me trying to understand how the system works, and noting down what stood out.
The problem
Bad decisions usually do not look bad at the start. They feel right. The damage shows up later.
People repeat the same mistakes because they only think about the first step. Cut prices, sales go up. But then competitors respond, margins shrink, and existing customers start asking for discounts. Most people do not think that far.
They also assume the average case. They do not ask what happens if they are wrong. They miss the fact that risks are often correlated, so one bad scenario can hit multiple things at once.
By the time all this becomes visible, it is usually too late. Auto Decision tries to make you see it before you commit.
Core idea
Use more compute (tokens) to think better.
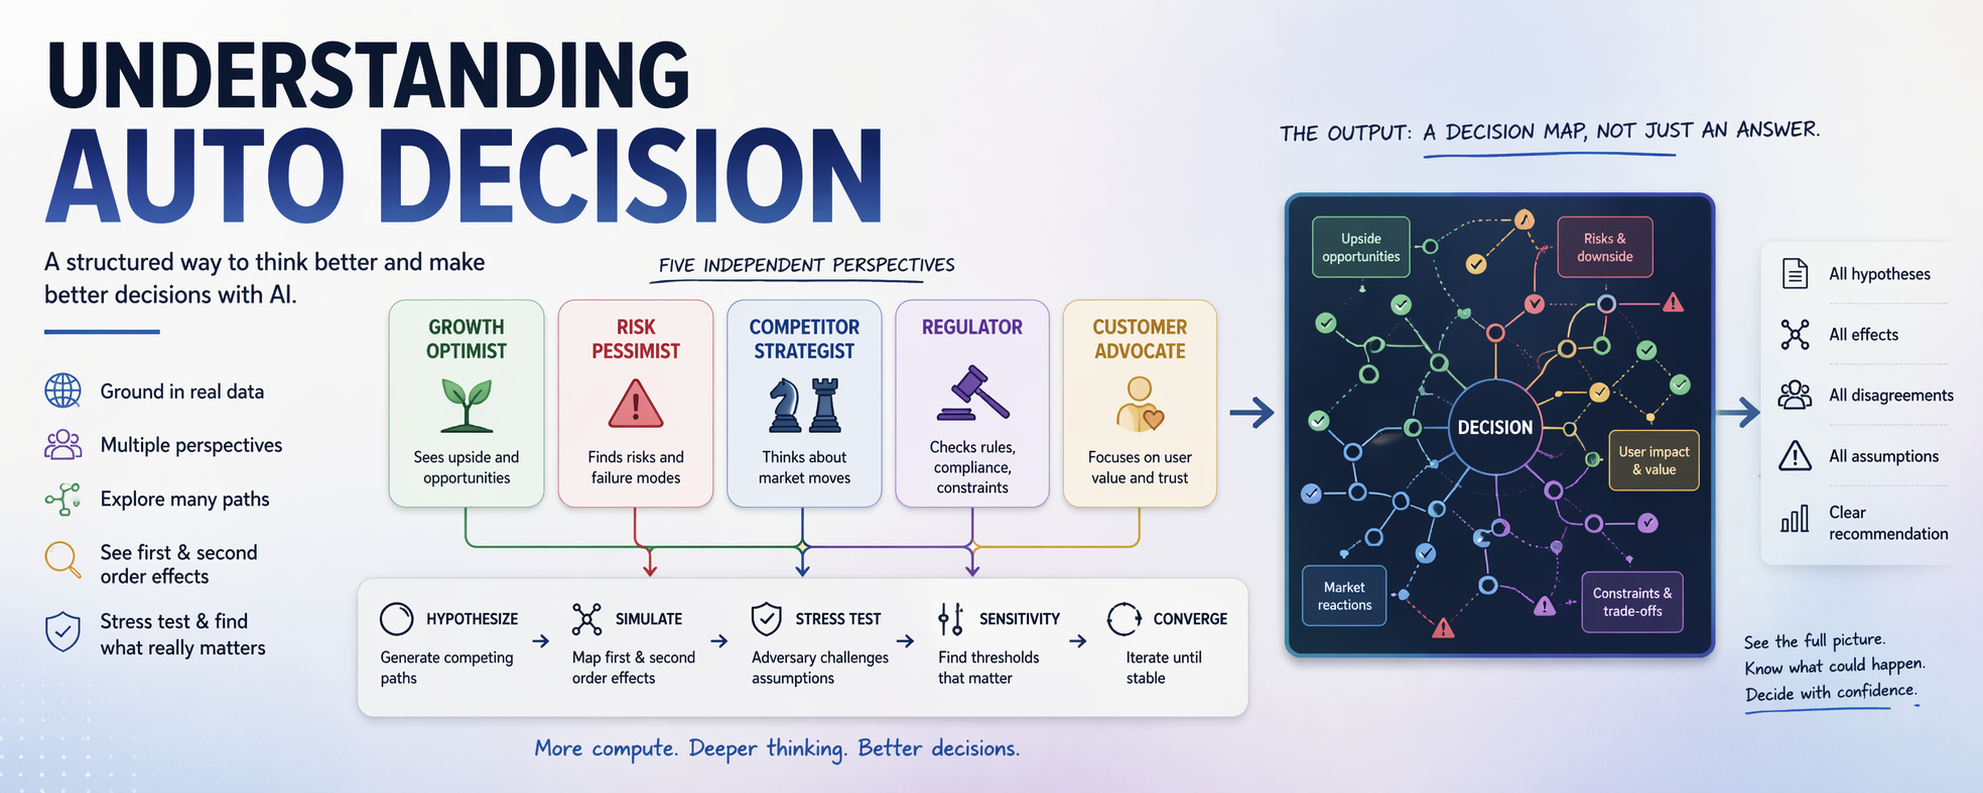
This is not about getting one answer. It is a structured simulation. Five different thinking styles run in parallel. They critique, stress test, and refine until the conclusions become more stable.
The real output is not just a recommendation. It is a map. Every hypothesis. Every effect. Every disagreement. Every assumption that needs to hold. The recommendation comes at the end, but the map is where most of the value is.
Five personas
Each persona runs separately. There is no shared context.
| Persona | Focus | Blind spot |
|---|---|---|
| Growth Optimist | Upside | Execution risk |
| Risk Pessimist | Downside | Cost of inaction |
| Competitor Strategist | Market dynamics | Assumes rational actors |
| Regulator | Compliance | Overweights regulation |
| Customer Advocate | User value | Ignores unit economics |
This separation matters. Shared context kills diversity.
One thing I liked is that each persona is also told what it is bad at. Most systems hide weaknesses. This one names them. That makes the output easier to read, because you know when to discount a view.
Anonymous critique
The analyses are relabeled from A to E. The reviewer does not know who wrote what.
So the argument gets judged on merit, not on the persona label behind it.
Pipeline
Phase 0: Scope
Break the decision into parts. Define success. Define constraints.
Phase 1: Ground
Use mandatory real data. If there is no real data, the run is marked UNGROUNDED.
Phase 1.5: Elicit
The system makes its assumptions visible. You can correct them before the rest of the process runs.
Phase 2: Hypothesize
Generate competing paths. Do not reduce the decision to a yes or no too early.
Phase 3: Simulate
Each persona looks at every hypothesis and maps first-order effects, then layers second-order effects on top. Every effect gets an ID, a probability, a range, and the assumptions it depends on.
All five outputs are then merged into one file called effects-chains.json. This file deduplicates repeated effects, preserves disagreement as ranges instead of averaging it away, tracks how many personas agreed on each effect, and catches hidden consensus where different personas reached the same idea through different routes.
This is where the value really shows up.
Take a pricing decision. The Optimist might say acquisition jumps at 0.75. The Pessimist might say existing-customer renegotiation happens at 0.80. Both can be true. The system does not flatten that tension. It keeps both visible.
That disagreement is useful. It tells you where the real uncertainty is.
Phase 4: Critique
One reviewer ranks the five analyses on groundedness, specificity, diversity of effects, and blind-spot coverage. It also surfaces the gaps that all five missed.
At first, I expected five reviewers. But the system uses one. The logic is that diversity already entered the process during Simulate. At Critique, you mainly need a clear ranker. Adding five reviewers would increase cost and likely add more noise than value.
That tradeoff made sense to me once I thought about it.
Phase 5: Adversary
This is the red-team pass.
A dedicated agent tries to break the analysis using worst-case scenarios, irrational actors, and black swans. It marks each assumption as solid, shakeable, or fragile.
And this is not a disconnected step. It feeds directly into Sensitivity. Adversary tells you which assumptions are weak. Sensitivity then tests them.
The two phases work together.
Phase 6: Sensitivity
Flip the key assumptions and identify the exact point where the recommendation changes.
If CAC is above X, stop. If churn is above Y, abandon.
For example, say one assumption is that the market is price sensitive. Now flip it to value-driven. If the recommendation changes, then the whole decision depends on which one is actually true. At that point, you stop debating and go gather evidence.
You come out of this with 3 to 5 triggers you can watch later. That is what makes the output practical.
Phase 7: Converge
Check stability across iterations. How many effects changed? How much of the assumption set stayed the same? How many rankings flipped? How many contradictions appeared?
If it is stable, stop. If not, loop again.
It also checks for false convergence, where the council looks aligned only because the perspectives were too similar to begin with.
Phase 8: Decide
Create a 16-section brief in a strict predefined format. No custom sections.
Insights are split into stable and fragile ones. Stable insights have high agreement and low sensitivity. Fragile insights are the ones where ranges stay wide or the answer flips easily.
Each run also updates cross-decision history and the assumption library, so over time the system gets better at spotting what usually holds and what usually breaks.
Phase 8.5: Validate
Run a schema check. If the brief does not match the required structure, it gets flagged before anyone reads it.
Everything gets quantified
This stood out to me.
Effects do not stay vague. Each one gets a probability in 0.05 steps, a [min, max] range across the council, an agreement count from 1 to 5, and a list of named assumptions it depends on.
Assumptions get quantified too. They are tagged as solid, shakeable, or fragile. Their stability across iterations is tracked as a percentage. They are rated HIGH, MEDIUM, or LOW on sensitivity. Each one also gets a numeric threshold at which the decision flips.
Even convergence is measured numerically through effect changes, assumption stability percentage, ranking flips, and contradiction count.
So instead of arguing on instinct, you end up arguing on something more concrete.
When to use it
Use it when the decision is expensive to reverse, when second-order effects are hard to see, or when the stakes are high enough that a structured exploration is worth the time.
Skip it for simple questions, low-stakes choices, and decisions where speed matters more than depth.
Spend the compute. See the map. Then decide.
Conclusion
The biggest shift for me was this: the recommendation is not the product. The map is.
Most decision tools compress everything into one answer. Auto Decision does the opposite. It lays out the full decision space. Every hypothesis. Every effect with a number attached. Every assumption that must hold. And the exact threshold where the answer changes.
Once you see a decision laid out like this, a one-line recommendation starts to feel incomplete.
This post is simply me noting down what stood out while trying to understand the system.
The project is open source on GitHub: harshilmathur/autodecision.